DonDakin
Well-known member
This chart makes a little more sense if the range line is in KM not miles.
Don......
Don......

Translating the numbers to metric ones, if you can go 160 Km's at 80 Kmh, or 80 Km's at 125 Kmh, in your smaller, more aero European version, then your graph is correct but a North American car can't and I doubt the Euro car could eitherBarbagris said:Anyway, if there is a big difference between the graph and the real world experience, the graph is poorly made. I need to re-check the numbers!
Perhaps with converter&motor efficiency no ideal (global 90%?), and bigger surface (SCx) the results were closer.
I'm seeing range on a full charge is closer to the 15 bar level. I haven't yet done a capacity test or a calibration. I run my tires at 45 psi and mostly drive 45 mph on a fairly level road. Marker lights only in the morning. No HVAC or heated seat.drees said:Reformatted the chart so it's readable here on the forum.Code:iChart:iMiev Range in MILES v5 – John Annen MPH 35 40 45 50 55 60 65 70 75 BARS % 16 100 100 90 83 73 67 62 56 52 47 15 94 94 84 76 67 61 56 50 46 41 14 87 87 72 71 62 57 52 57 43 39 13 81 81 72 66 59 53 49 44 41 36 12 72 72 64 58 51 57 43 39 36 33 11 66 66 58 53 47 43 40 36 34 31 10 60 60 52 47 41 38 34 30 28 27 9 56 56 49 44 39 36 33 29 26 24 8 50 50 47 41 37 35 31 27 24 21 7 44 44 37 33 29 26 24 21 20 18 6 37 37 31 27 23 21 19 17 15 14 5 31 31 26 22 18 16 14 12 11 10 4 25 25 21 18 15 14 13 14 12 9 3 19 18 18 15 14 13 12 10 9 7 2 12 12 12 10 9 9 8 7 6 5 1 6 6 6 5 5 4 4 4 3 3
How accurate is this chart in people's real-life experience?
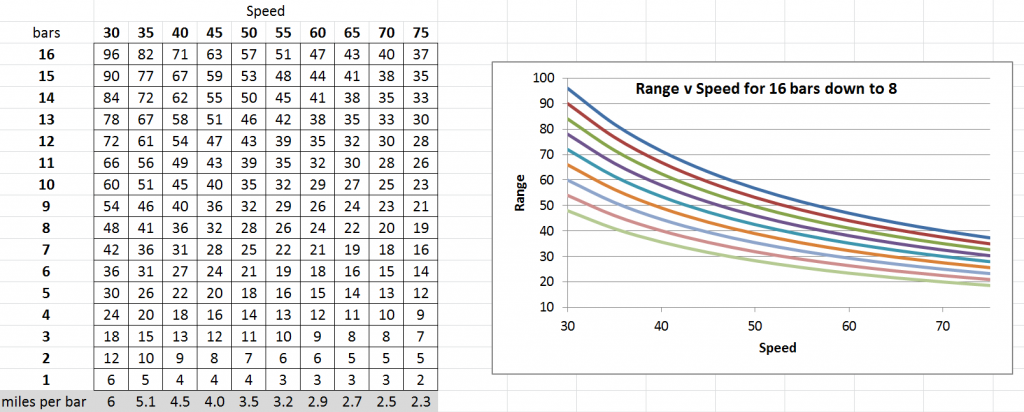
That looks much more realistic to me - It also correctly points out that you can go about twice as far at 40 mph as you can at 75 mph (and nearly 3 times as far at 30) so if you're pressed for range, slow down!!kps70 said:Does this feel a little more realistic?
fjpod said:All well and good, but............life doesn't follow charts.
Have you ever been stuck in traffic in the middle of an ice storm, when it should only take you 15 minutes to get home, but it takes 2 hours? Hard to not use your heater, but even though you are creeping at 5 mph, you are spending an hour and 45 minutes more time in the car.
Bye bye battery.
Don't get me wrong. I love my iMiev.
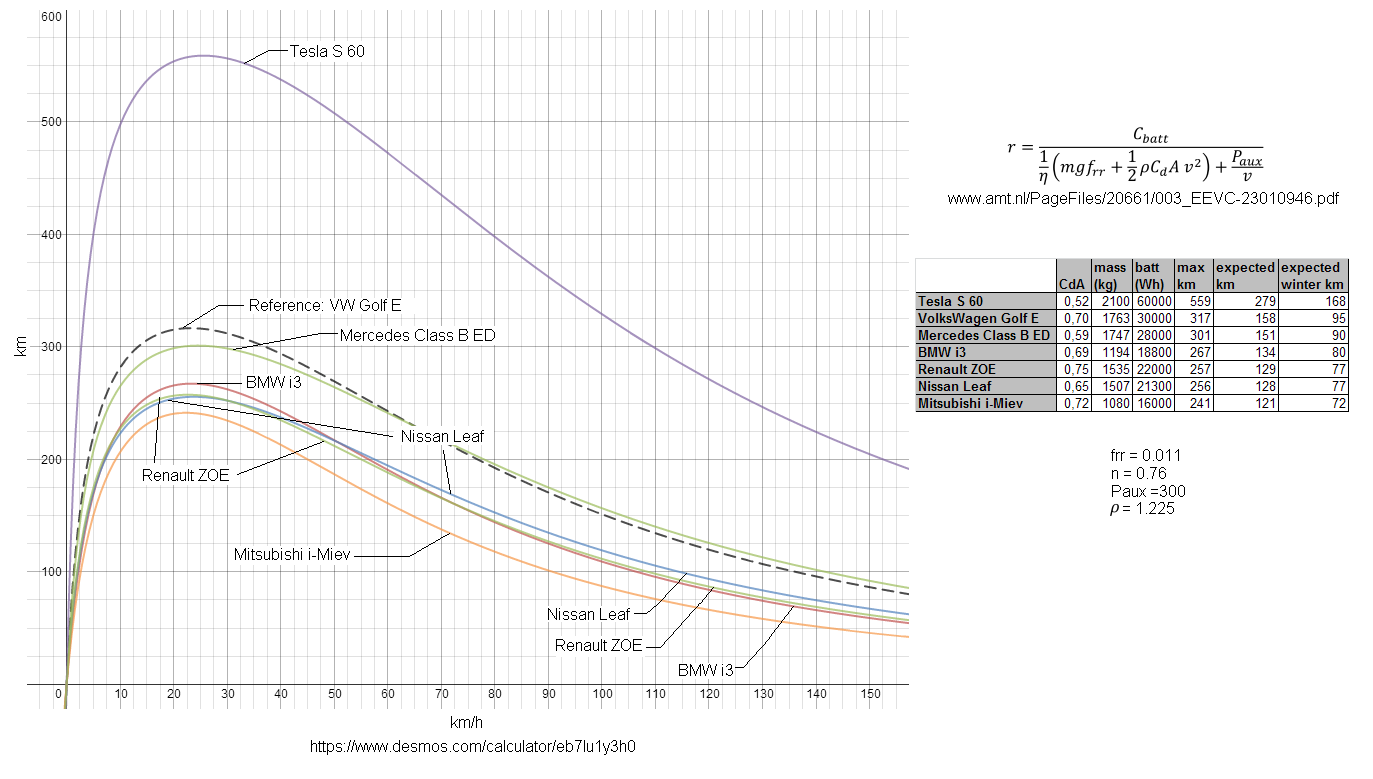
JoeS said:jumpjack, thank you very much for posting these graphs. Now that you have the i-MiEV CdA, will you be updating this graph to just show the i-MiEV alone?
Enter your email address to join: