Battery Capacity and Computed SoC OBDZero BMU PID 762

Mitsubishi i-MiEV Forum

Help Support Mitsubishi i-MiEV Forum:

This site may earn a commission from merchant affiliate links, including eBay, Amazon, and others.

CZeroOwner

Well-known member
Supporting Member
Joined
Jan 15, 2018
Messages
106
Location
Denmark
On March 13, 2023 I updated OBDZero to version 4.00. In this version there are 4 new screens:


The Ah screen is of particular interest because both the capacity and the present charge come from the BMU PID 762. The capacity is the same as that reported by CaniOn and EvBatMon. The present charge is new as far as I know. Together they permit computing a SoC that is a bit more precise than that reported directly by the car. This computed SoC is most similar to the SoC 1 reported by the car and shown in OBDZero. It is less similar to SoC 2 shown in OBDZero and reported as SoC by other apps. Knowing the BMU's Ah account makes a more accurate calibration of the battery amps measurement possible. More on this later.

Se the manual at:
https://obdzero.dk/wp-content/uploads/2022/08/OBDZeroUserManual38.pdf
for more details.
 
Computing the Amps to and from the Battery

Comparison-of-accumulated-and-reportred-Ah.png

This graph shows a slow charging of the battery recorded a couple of months ago. The green line is the BMU’s present charge in amp hours (AhBMU) using data from PID 762. The red (AhCal) and blue (AhOrg) dotted lines are computed present charges in Ah based on the amps to and from the battery.

AhOrg is the accumulated Ah using this formula for the amps to and from the battery:
PID 373: (((D3 * 256) + D4) - 32768) * 0.01 = Pack Amps In

AhCal is the accumulated Ah using this formula:
PID 373: (((D3 * 256) + D4) - 32700) * 0.01 = Pack Amps In

To compute the accumulated Ah for the red and blue lines, I first computed the added Ah in each time step by multiplying the time step in hours with the average of the amps at the start and finish of the time step. Then I started both the red and the blue lines in the graph with the AhBMU start value of 7.8 Ah. Finally I added the step Ah to the previous sum of Ah for each step from 20:38:43 to 05:35:02. At 05:35:02 the BMU Ah was 38.2, AhOrg was 32.12 and AhCal was 38.19.

It is clear that the accumulated Ah based on the AhCal formula agrees much better with the BMU Ah. Therefore this is the formula for the battery amps that is used in OBDZero.

I used the formula for AhOrg in the first versions of OBDZero. I believe this formula came originally from a file named iMievFormProgram.txt that I found back in 2016. I don't remember who wrote it.
In 2018 I argued for a correction of + 0.66 amps based on a comparison of the accumulated Ah when charging and discharging. https://myimiev.com/forum/viewtopic.php?p=36989#p36989
I now know that +0.68 is the better correction. This gives the same result as the AhCal formula above. A correction of only +0.66 gives an Ah of 38.02 compared to the BMU value of 38.2. Not bad but not as good as AhCal.
 
kiev said:
Kolyandex posted about the first 2 bytes of PID 374:
1st byte is "Control SOC",
second byte is "Display SOC"

I take that to mean the control value to the EVECU and the value sent to the dash fuel gauge display.

I think I can now show this to be true.

Comparison-of-So-C1-and-BMU-Ah.png


This graph shows the 10 min pause in slow charging from the same session shown in the post above. The purpose of this pause is to measure the true SoC of the battery based on the 0 load battery voltage. Note that SoC1, the green line, hops up and down as the voltage drops to the 0 load voltage from the higher charging voltage. There is a natural delay due to the battery's capacitance. This means that SoC1 is adjusted by the BMU to the true SoC. At the same time the present charge, BMU Ah, first increases then decrease again. I believe this is in response to the changes in SoC1. During the pause the BMU fully charged capacity of 38.5 Ah does not change. Therefore the BMU computation is:
Present charge = SoC1 * capacity/100

For the first change in present charge: 27.3 = 71 * 38.5 /100
For the second change in present charge: 27 = 70 * 38.5 /100

The present charge doesn't follow the SoC1 precisely because of the limited resolution of the numbers and because the present charge is only recorded at 1 minute intervals.

Before and after the 10 min pause the BMU computes the present charge and the SoC1 based on the measured amps to and from the battery. In other words SoC1 depends on the BMU’s present charge most of the time. It is only during the 0 load pause that the reverse is true.

During the pause the blue line SoC2 doesn’t change and the SoC display on the instrument panel is stable. If the SoC display did hop up and down it would be disconcerting.

To clear up any questions SoC1 is the 1st byte mentioned by Kolyandex and SoC2 the 2nd byte.
 
Great catch to find that out. We have always wondered why the charging would stop for a short break and you have discovered the reason here.

The MUT tool can read and write Data List Items of the various control units thru the OBDII port. Do you have any ideas if this is using the CAN buss, or maybe the K-line for communication? This is the next hurdle to getting the battery pack upgraded to new larger capacity cells.
 
kiev said:
Great catch to find that out. We have always wondered why the charging would stop for a short break and you have discovered the reason here.

The MUT tool can read and write Data List Items of the various control units thru the OBDII port. Do you have any ideas if this is using the CAN buss, or maybe the K-line for communication? This is the next hurdle to getting the battery pack upgraded to new larger capacity cells.

Thanks kiev.

Before reading this I didn't know that there was anything other than the CAN bus. So I dug into the service manual and found this:

LIN network
Lin-Network.png


CAN network
CanBus.png


Which you probably have seen already. This seems to show that the BMU and the MUTIII are both connected via the CAN bus not the LIN bus and that the LIN bus only connects ECUs with the master ECU. As I understand it LIN is the protocol used on the K-Line. But I have no practical knowledge of the two systems. My work begins and ends at the OBD connector.

Cheers
David
 
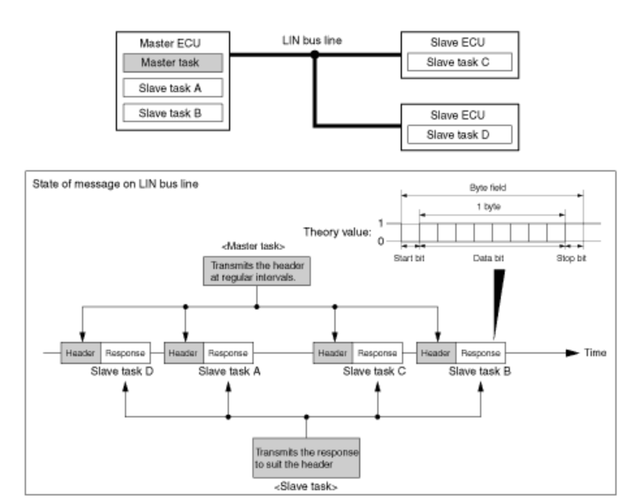
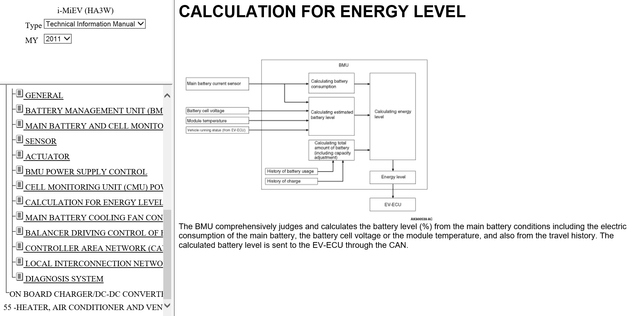
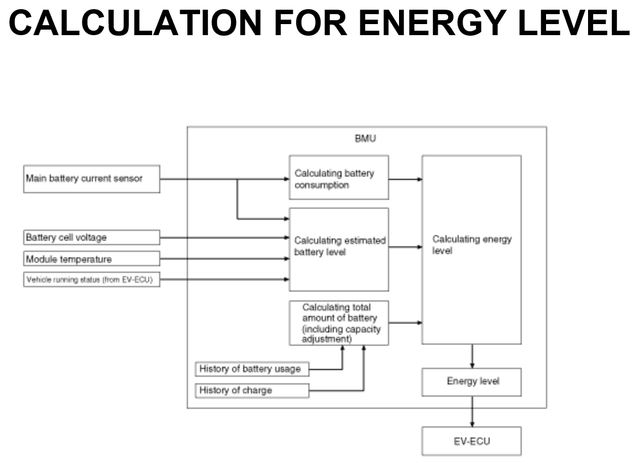
This diagram of the Battery Management Unit (BMU) from the iMiev Technical Information Manuel outlines the iMiev method of measuring the present fully charged capacity (just capacity from now on) of the car’s battery as reported in PID 762. This method also applies to the iOn and CZero cars.

Calculation-of-Battery-Level-Service-Manual.png


Calculation-of-Battery-Level-Diagram.png


The diagram shows three calculations feeding information to a calculation of the energy level (SoC) in the battery. The manual contains no further information on how these calculations are performed.

The top calculation “Calculating battery consumption” shown in the diagram receives a signal from the main battery current sensor. This system probably keeps an account in ampere-hours (Ah) of the current to and from the battery. This is called coulomb counting.

Capacity is calculated by the bottom calculation named “Calculating total amount of battery” (CTAB). The following is an analysis of this capacity calculation based on data collected by two of us, joloeber and iOnier, both contributors to the German GoingElectric forum. https://www.goingelectric.de/forum/viewforum.php?f=222

It is important to keep in mind, that we are reverse engineering a calculation of battery degradation programmed into the BMU by Mitsubishi engineers prior to the car leaving the factory. We are not calculating the true capacity of the battery.

Capacity-Paper-Figure1.png

joloeber iMiev 2011

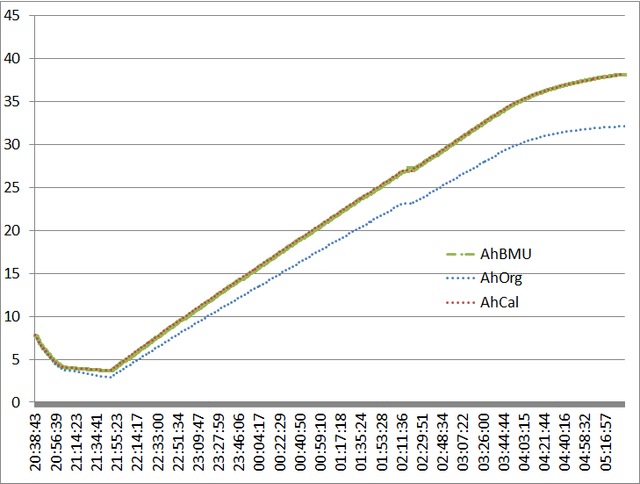
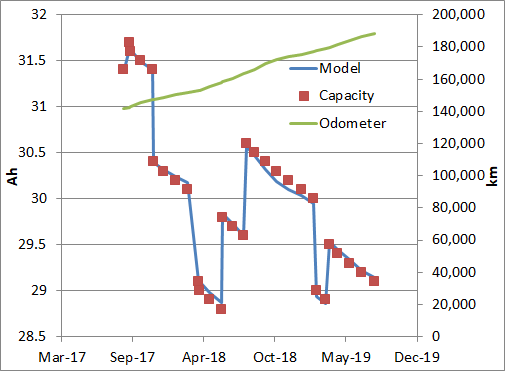
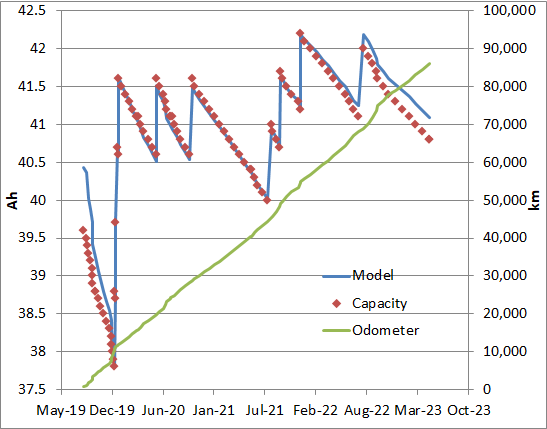
This first graph shows the data record by joloeber from his 2011 iMiev using the CaniOn app. For clarity the capacity is shown as a time series. However the change in the capacity follows the car’s mileage more closely than the age of the car. Therefore, the model shown in the diagram is:

Ah = 48 - 0.0388 * sqrt(km) plus or minus 1 Ah corrections.

Note that this agrees with the input “History of battery usage” to the CTAB shown in the BMU diagram. The correction agrees with the “capacity adjustment” in the CTAB. We believe this capacity adjustment comes from the capacity measurement done while slow charging. This is the “History of charge” input.

The measurement done while slow charging, was described in another post. It requires the SoC to be less than 70% before charging and 100% after charging.

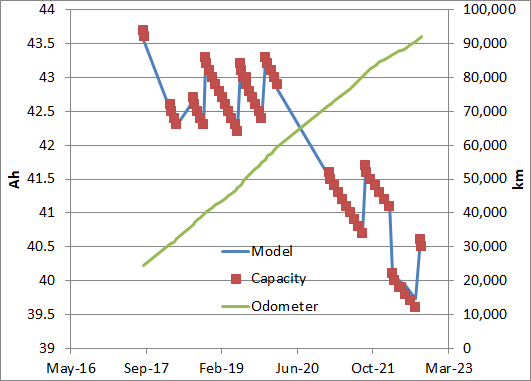
The next graph shows capacity data from joloeber’s second car, a 2015 iMiev. This was also collected using CaniOn.

Capacity-Paper-Figure2.png

joloeber iMiev 2015

The model in this case is:
Ah = 48 - 0.0355 * sqrt(km) plus minus 1 Ah corrections

Note that there is poor agreement between the model and the capacity for the first series of data ending in mid-December 2019. This may be due to the long time between the build in 2015 and the first km driven in 2019. This requires further analysis. The factor 0.0355 is similar to the 0.0388 for the 2011 iMiev. Considering the accuracy of the models the factor could be the same for both cars.

Also interesting is the rapid correction of the capacity from 37.8 Ah to 41.5 Ah in the space of one month starting in mid-December. This occurred in 1 Ah steps, the largest correction permitted by the BMU calculation.

Capacity-Paper-Figure3.png

iOnier iOn 2015

This last data set is from iOnier’s 2015 iOn collected using CaniOn. The model is:

Ah = 48 - 0.054 * sqrt(km) plus minus 1 Ah corrections

In this model the factor 0.054 is significantly larger than the factors for joloeber’s cars. The difference is probably due to the difference between the km driven per day. IOnier drives an average of 38 km/d while joloeber drove 68 km/d in his 2011 car and drives 61 km/d in his 2015 car. (Datom, in his analysis of the data on the German GoingElectric forum, included km/d as a factor.) IOnier’s factor is larger because the BMU also takes time and aging into account when computing the capacity. In other words there are more days per km for iOnier’s car than joloeber’s and the factor in this model for iOnier’s car must be larger to account for this.

This means that the correct model should include both the age of the car and the number of km driven. We have not found this model yet. More data from cars with different km per day would help.

Capacity-Paper-Figure4.png

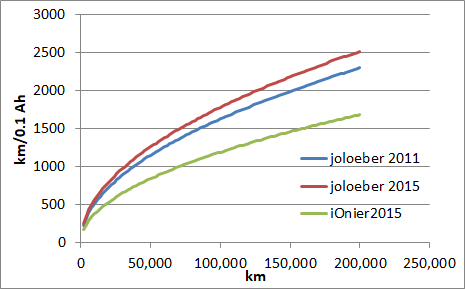
This graph shows the average number of km between 0.1 Ah downward steps of the capacity computed by the BMU. This graph was computed using the models show above.

The graph shows that iOnier’s iOn loses 0.1 Ah after fewer km than joloeber’s iMiev because it takes iOnier longer to drive those km. Again time plays a role in the BMU capacity calculation as well as km driven. It also shows that the Mitsubishi engineers that designed the system expected the rate of degradation to slow as the battery aged.

These observations have some interesting consequences. Of these the most important is that the battery capacity deterioration is in fact much slower than the Mitsubishi engineers expected at least for iMiev/iOn/CZeros in Germany. This is indicated by the frequent 1 Ah upward corrections in the capacity shown in the graphs above. The reason for this may be that the engineers had to account for cars operating at higher temperatures than the average in Germany.

Another important consequence can be seen in the data from joloeber’s iMiev 2015. This car spent almost 3 years from its build date to its first use. During that time it may not have been charged properly such that the BMU could measure the capacity. However the BMU deterioration model was running all the time, steadily reducing the BMU’s capacity estimate. As soon as joloeber began charging the car normally the BMU was able to correct its very low capacity estimate to a much more reasonable value.

In conclusion it is necessary for the BMU calculation of the battery capacity that the car be slow-charged from less than 70% SoC to 100% on a regular basis. This insures that the BMU measures the capacity and can make the necessary adjustments to its preprogrammed capacity estimate. If the measurement isn’t performed because e.g. the car isn’t charged to 100% or the car is only charged via the Chademo port, the BMU capacity will slowly and regularly decrease until it is well below the true capacity of the battery.

joloeber, iOnier and CZeroOwner
 
Back
Top